Overview
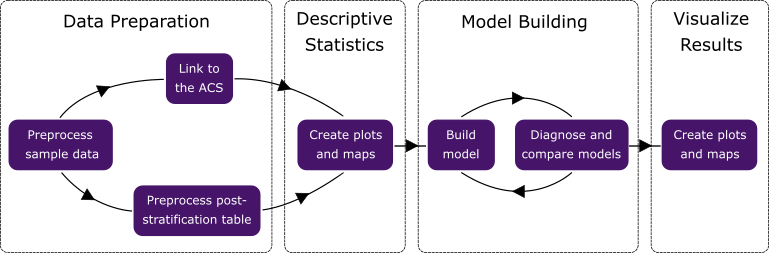
shinymrp is an R package that presents both an intuitive graphical user interface (GUI) and a flexible programmatic interface (API) for Multilevel Regression and Poststratification (MRP). Designed for diverse users, from analysts to advanced modelers, its end-to-end workflow supports all stages of MRP applications, from data cleaning to visualization. Both interfaces follow the same logical workflow:
- Data Preparation
- Descriptive Statistics
- Model Building
- Result Visualization
If you prefer a graphical and interactive experience, you can launch
the Shiny app with shinymrp::run_app(), which includes a
built-in user guide. Users interested in using the programmatic
interface can follow examples in the vignettes, starting with the Key
steps section below.
Key steps
The shinymrp R6-based interface is ideal for users
who want full scripting control and have access to high-performance
computing resources. The workflow is object-oriented, with your main
point of interaction being the MRPWorkflow object. This
object provides methods for every stage of your analysis.
Start by loading the package and creating your workflow object.
library(shinymrp)

# Initialize the MRP workflow
workflow <- mrp_workflow()
Below is a typical workflow illustrated step by step.
1. Data preparation
First, we preprocess a sample dataset and obtain poststratification data from the American Community Survey (ACS) or custom uploads. Here’s an example using built-in sample data and linked ACS:
# Load example data
sample_data <- example_sample_data()

# Preprocess the input data
workflow$preprocess(
  sample_data,
  is_timevar    = TRUE,
  is_aggregated = TRUE,
  special_case  = NULL,
  family        = "binomial"
)

# Retrieve the cleaned data (optional)
clean_data <- workflow$preprocessed_data()

# Link to ACS and obtain poststratification data (e.g., by ZIP code)
workflow$link_acs(
  link_geo = "zip",
  acs_year = 2021
)
2. Descriptive statistics
Before modeling, it’s crucial to explore your data. The workflow object includes built-in visualization tools:
# Bar plot of a demographic variable
workflow$demo_bars(demo = "sex")

# Map of sample size by geography
workflow$sample_size_map()

# Plot the distribution of the outcome variable
workflow$outcome_plot()
3. Model building
Model specification is highly flexible. You can set priors for intercepts, fixed effects, and standard deviations of varying effects (e.g., random effects and residuals). Fit the model using Stan’s Markov chain Monte Carlo (MCMC) algorithm, assess convergence, and compare different models:
# Specify and create the model
model <- workflow$create_model(
  intercept_prior = "normal(0, 4)",
  fixed = list(
    sex  = "normal(0, 2)",
    race = "normal(0, 2)"
  ),
  varying = list(
    age  = "normal(0, 2)",
    time = "normal(0, 2)"
  )
)

# Fit the model: MCMC sampling
model$fit(n_iter = 500, n_chains = 2, seed = 123)

# Inspect summary and diagnostics
model$summary()
model$diagnostics()

# Posterior predictive checks
workflow$pp_check(model)

# Compare different models using leave-one-out cross-validation
# workflow$compare_models(model, another_model)
4. Result visualization
Visualize estimates for the overall population, demographic groups, and geographic regions. For spatial results, users can create interactive maps at specific scales and time points (if the data is time-varying).
# Plot estimated outcomes by demographic group
workflow$estimate_plot(model, group = "sex")

# Choropleth map of geographic estimates
workflow$estimate_map(model, geo = "county")
Additional resources
- For more details on input data requirements and preprocessing, see the vignette on Data preprocessing.
- For a more detailed walk-through of each method, output interpretation, and recommended practices, see the Programmatic workflow demonstration vignette.
- For elaboration on the theoretical background of MRP, see the Methodological guide vignette.
- For Shiny app users, launch the interactive GUI via
shinymrp::run_app()or, to try it online without installation, visit the demo.
Note: This product uses the Census Bureau Data API but is neither endorsed nor certified by the Census Bureau.